

Two ways to measure long-term value and the assumption they share
The Numerator | Issue #1 | May 7, 2026


You have probably had this conversation, from one side or the other. A feature shipped, the short-term metric is flat or down, and someone in the room says “future value will catch what the experiment cannot.” The model gets pulled up. Sometimes it agrees with the team and the feature ships. Sometimes it disagrees and the feature does not. Either way, nobody in that room asks a question that should be the first one: how often does this model actually agree with the long-term truth when we wait long enough to check?
Netflix asked it on themselves. Across 200 A/B tests and 1,098 test arms, they checked their 14-day surrogate index against the day-63 ground truth. The headline number, the one most posts about this paper quote, is 95% directional consistency. The number that should follow it, and almost never does, is 65% recall against the day-63 ship decision. That is not the model failing on edge cases. That is the model deciding the next quarter of your roadmap.
This post is the practitioner version of long-term value measurement, focused on the two methods you will see most in published industrial work: PSM-style action scoring (Airbnb FIV) and the surrogate index (Netflix, Booking.com). Other families exist, including one built on heterogeneous treatment effects with policy trees, but the two we focus on are the ones that show up in the most launch reviews and the ones whose tradeoffs are best documented in public.
I have watched some version of this play out at Google Waze and Amazon Alexa Shopping. Different names, different math, same shape. Sometimes it held us back from rolling out a feature the team had spent months on. Sometimes it gave us the language to measure a win and defend it to leadership when the short-term metrics could not. Either way, you pay twice. Once in model maintenance, and once in the stakeholder time it takes to explain what the model did and did not say. Here is what the published implementations look like and where they break.
The Numerator is practitioner notes on product data science at consumer scale. Written by Harel Rechavia, formerly Google Waze, Amazon Alexa Shopping, and Viber. Subscribe for one or two posts a month.
Airbnb FIV: scoring actions from the past
Some product actions create most of their value over a horizon experiments cannot reach. Account recovery setup is the canonical example. The 14-day metric is the percentage of accounts that completed the recovery setup flow. The actual value is the percentage of takeover incidents resolved in five minutes instead of churning. Six months downstream. Invisible inside the test window.
The same shape repeats:
First-time wow moments. First booking, first ride, first family-plan invite. The action’s value lives in retention curves that bend months later.
Latency and crash fixes. A single bad session raises churn risk that does not appear in the same session’s metrics.
Trust and safety actions. Two-factor enrollment, blocking, reporting. Rare events with enormous per-event value and volume too low to move aggregates.
Onboarding milestones. Profile completion, payment method added, social graph seeding. Each one is friction in the moment.
If your org has no way to count downstream value, the org systematically does not ship these features. The portfolio bends toward features whose value is visible inside a 14-day window. That is a poor proxy for what users actually care about.
Airbnb’s Future Incremental Value (FIV) is the most fully published implementation of the first family. For each of about 150 action events, Airbnb estimates the propensity that a given user takes the action, matches each user who took it to a “twin” who looks similar in propensity but did not take it, and reads the long-term outcome difference between the two groups as the action’s incremental value over a 1-year horizon. The propensity model uses around 1,000 control features pulled from their internal feature store.
Output is split into “Present” (immediate) and “Future” (residual downstream) value. PMs see what fraction of an action’s value is downstream rather than realized today. That UX choice does real work. It lets a team defending a slow-payoff feature point at the Future component instead of arguing in the abstract.
The math
Let’s walk through FIV first. For each user, estimate the probability they took the action of interest, given their pre-action covariates. This is the propensity score, learned across about 1,000 covariates from the feature store. Match each user who took the action to a “twin” with a similar propensity who did not. The action’s average effect on the treated is the difference in long-term outcomes between focal users and their matched complements.
The long-term outcomes here are observed, not predicted. The action happened in the past, you waited the full horizon, you read the actual metric. This is why FIV needs historical data and cannot score brand-new product surfaces.
Identification rests on three assumptions. Unconfoundedness: there are no unobserved confounders once you condition on the covariates. Common support: every region of the propensity is represented in both the focal and the complement populations. SUTVA: no spillovers between users. SUTVA fails in two-sided marketplaces, which is why Airbnb adds an explicit cannibalization haircut.
The practical breakpoint is overlap. If your propensity model has high AUC, the treated and untreated populations are too separable, the matched twins are not really twins, and the estimator becomes unstable. You actually want a propensity model that struggles at the boundaries.
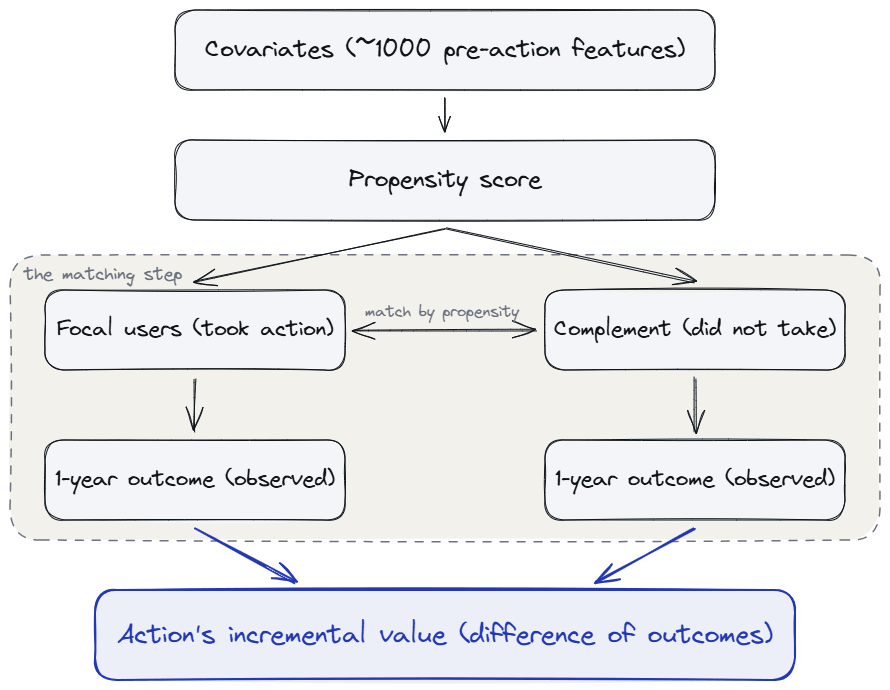
The PSM recipe: ~1000 pre-action covariates feed a propensity score, which splits users into focal and complement, matches them by similar propensity, then reads the difference in observed long-term outcomes as the action’s incremental value.
The surrogate index: predicting an experiment’s long-term effect
Long before Netflix put the recall problem on paper, Pinterest published a 1% holdout on a badging feature. The short-term A/B test showed +7% DAU. The year-long holdout settled at +2.5% DAU. The short-term test overstated the win by roughly 2.8x. That is not a Pinterest fact. That is a category fact about novelty inflation in self-serve consumer products. Carry it as the working order-of-magnitude assumption for any short-term readout you cannot validate against a long-term holdout.
The surrogate index is what you use when you want a long-term answer but cannot wait a year. It replaces the slow primary outcome with a model-predicted index built from short-run signals. Netflix’s surrogate-index validation paper walks through the method and validates it against 200 of their own A/B tests. They estimate, from historical data, a function that maps short-term proxies S and pre-treatment covariates X to a predicted long-term outcome. In a new experiment, they observe S during the test window, predict the long-term outcome per unit, and treat the difference between treatment and control on that prediction as their long-term effect estimate.
The identification assumption that does the heavy lifting is called surrogacy. It says S contains all the information about how treatment affects the long-term outcome. If treatment moves the long-term outcome through a channel that is not captured in S, the estimate is biased and you will not know it.
Netflix’s number on themselves: 95% directional agreement, 65% recall against the day-63 ship decision. The recall gap is where senior DS should focus. Directional agreement covers most of your routine launches. The recall gap is concentrated on the launches with the largest upside, where the cost of a false negative is highest.
Booking.com’s KDD 2024 paper generalizes the proxy choice as a portfolio optimization problem over a corpus of past experiments. Treat each prior experiment as labeled data: a vector of short-term effects and a long-term effect. Learn the linear combination of short-term metrics that best predicts long-term effect for new experiments. The unsubtle practical insight: the optimal proxy varies with experiment sample size. There is no single “best company-wide proxy.” The published shorthand papers over a real cost.
The math
In a historical sample, fit a model that predicts the long-term outcome from a vector of short-run surrogate metrics plus pre-treatment covariates. In a new experiment where only the short-run surrogates are observed, predict the long-term outcome per user, then take the difference between treatment and control on that prediction.
Identification rests on Prentice surrogacy: the long-term outcome is independent of treatment once you condition on the surrogates. If treatment moves the long-term outcome through a channel the surrogates do not capture, the estimate is biased and you will not know it. There is also a comparability assumption: the relationship between surrogates and outcome must be the same in the historical and experimental samples.
Booking.com’s portfolio framing replaces the per-experiment estimation with a learned linear combination of short-run metrics, optimized across a corpus of past experiments.
The practical breakpoint is the validation result that started this post. 65% recall against the day-63 ship decision, even with a careful production system at Netflix’s scale. That is the cost of the assumption.
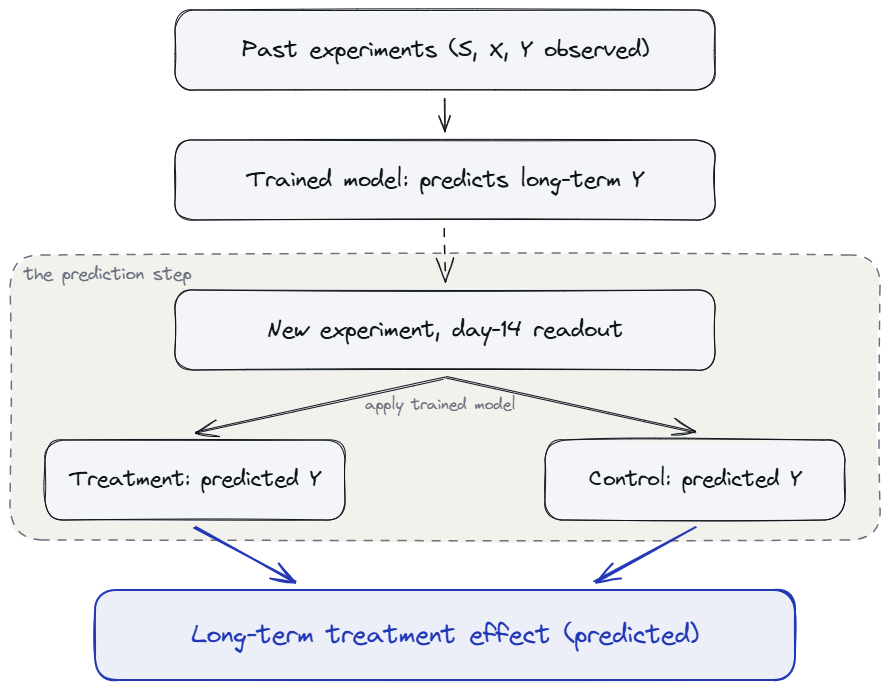
The surrogate index recipe: a model trained on past experiments where both short-run signals and long-term outcomes were observed, applied to a new test to predict the long-term treatment effect from short-run signals alone.
How they differ
The two methods sit in different places in your workflow, and the easiest way to keep them straight is to ask what counts as a row of training data.
For Airbnb FIV, a training row is a (user, took the action or not, observed long-term outcome) triple. The unit of analysis is the user-action pair. The output is a fixed table: each tracked action has an FIV score that says “this action is worth X on the north star metric over the long term.” A PM whose A/B test shows the feature drives 5% more recovery setups multiplies that 5% by the recovery-setup score to get a long-term value estimate. Real features usually move more than one action, so the same test might also show +2% on 2FA enrollment and -1% on profile completion. The feature’s total long-term value is the sum of (action lift × FIV score) across every action it moved, without waiting a year for the long-term outcome to land.
For the surrogate index, a training row is a past experiment (or a user inside one) with both a short-term effect vector and a long-term effect. The unit of analysis is the experiment. The output is per-experiment: this specific test predicts +1.2% on the long-term metric. You use it after a test ends, before you have day-63 data.
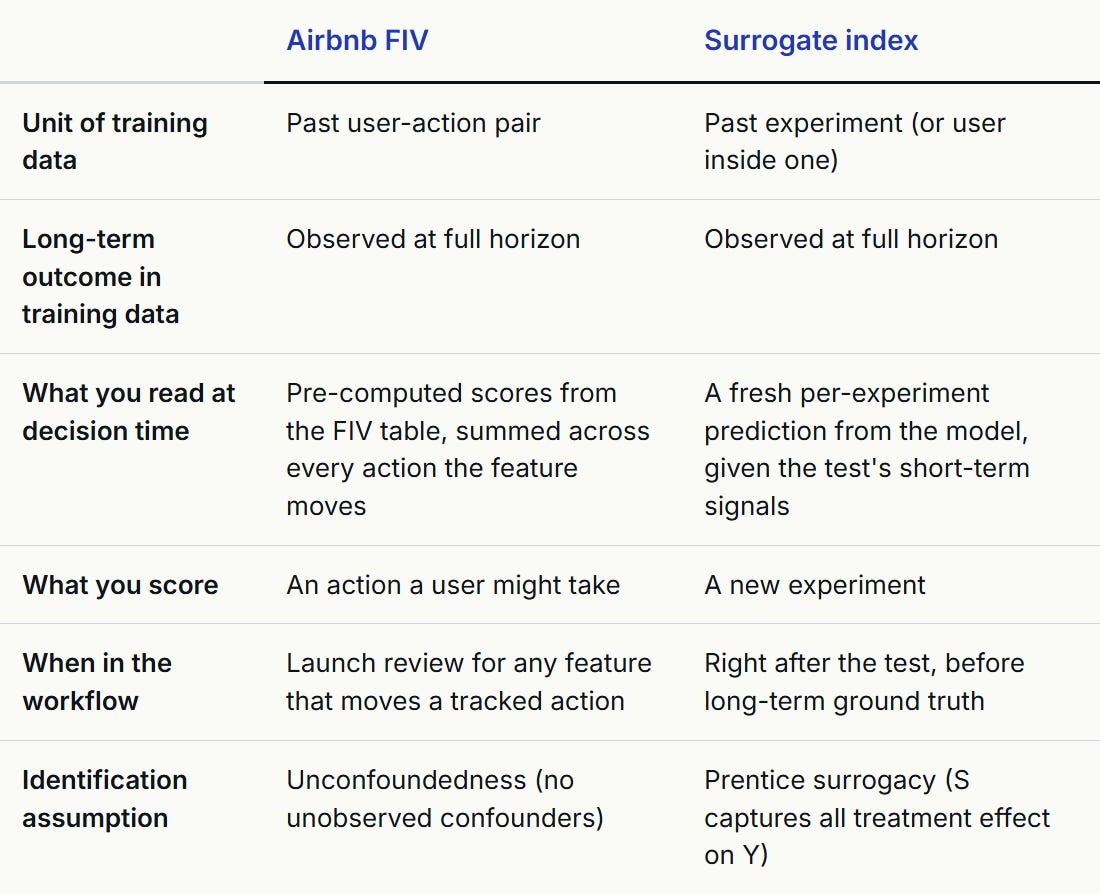
Horizons differ too. Airbnb publishes at 365 days. Netflix validates at 63 days. Most of that difference is business cycle, not method. Streaming engagement stabilizes inside two months because users return weekly. Travel is low-frequency and seasonal, so a 60-day window misses most of the signal. The smaller part is method economics: a surrogate index needs the long-term outcome to materialize on a cadence that lets you retrain, which biases the family toward shorter horizons even when the business case might want longer. PSM does not have this problem, which is part of why FIV-style work tends to publish at longer horizons than surrogate-index work. If Netflix’s NSM stabilized at 365 days they would still pick a shorter surrogate horizon for retraining sanity. If Airbnb’s NSM stabilized at 60 days they would happily run FIV at 60.
The two methods look different. The math is genuinely different. The FIV claim that does the heavy lifting is that nothing unobserved drives both the action and the outcome.
The honest version is not “our model agrees with truth 95% of the time.” It is “our model agrees with truth 95% of the time on the experiments and the time horizons where we could check, and we cannot test whether this generalizes.”
Where these methods fall apart
It does not work for new features.
The historical data the surrogate index needs to validate against does not exist for a brand new product surface. The honest answer when leadership asks for the future value of a feature you launched last month is “we cannot estimate it for another quarter.” Some leaders accept this. Others do not.
Eligibility-gated features are hard.
If only some users qualify, due to subscription tier, region, or device class, matching has to happen within eligibility strata. The number of models you maintain explodes and the matched cohorts get small fast.
It needs population scale.
PSM and surrogate models both need enough observations to estimate stable propensities and stable proxy-to-outcome relationships. Airbnb explicitly says their host-level FIV is underdeveloped because there are not enough hosts. If you are at a sub-million MAU consumer product or B2B SaaS, the method may be infeasible.
Two-sided marketplaces have a double-counting problem.
A guest action and a listing action can both legitimately claim credit for the same booking. Airbnb’s Platform FIV is their attempt to net this out. It is not solved.
Maintenance is expensive, and the cost is mostly human rather than technical.
The model needs ongoing feature engineering as new product surfaces ship, but that is the easy part. I have watched the DS who built one of these systems end up spending more of their time onboarding new contributors and walking stakeholders through how to use, and how not to misuse, the framework than on the model itself.
The model can also become political.
PMs who like a feature might trust the model when it agrees with them and challenge it when it does not. Teams whose features get killed by an FV verdict might request re-runs, alternative specifications, sensitivity analyses. This is healthy in moderation and corrosive at scale. Maintaining trust in the model is a real cost on top of maintaining the model itself.
A simplified proxy is gameable in the Goodhart sense.
Gibson Biddle’s hidden-800-number example is the evergreen case study: a PM at a streaming company decides “contacts per 1000 streams” should go down, hides the customer support phone number, and the metric improves while the customer experience degrades. Once the proxy becomes the target, the proxy stops measuring what it was designed to measure.
The honest takeaway
Long-term value measurement is a complement to clean experimentation, not a substitute for it. Short-term A/B tests are still the right tool for short-term questions, guardrail metrics still matter, pre-registered hypotheses still help. The future value layer sits on top and answers questions experiments cannot.
The features it surfaces are real. Account recovery setups, latency improvements, fraud reporting flows, the unsexy infrastructure work whose value is invisible inside a 14-day window. These features ship in companies that have a long-term value layer and quietly do not ship in companies that do not. Over years, the gap compounds.
The cost is also real. A serious program needs population scale, ongoing data science investment, leadership trust, stakeholder patience, and a long-term holdout you keep funded. Most companies should not build the full platform first. The companies that should build one and do not are the ones leaving the most value on the table.
If your org is in that second category, the move is not to build the full machinery. The move is to start with one specific action where the case is obvious and the data is available. Build a small surrogate or PSM model for that one action. Validate it once against a long-term holdout. Show the result. If the model holds and the result lands, the second model is easier to fund. After about ten such actions, you have a program.
That is roughly how every company in this post got there. Nobody built the platform first. And nobody published a recall number that suggested their model was anywhere close to perfect. The 65% number is not a Netflix problem. It is a structural cost of operating under an assumption you cannot test. The mature move is to plan for it instead of hoping it does not apply to you.
Further reading
Airbnb Engineering, How Airbnb Measures Future Value to Standardize Tradeoffs
Zhang, Zhao, Dimakopoulou, Le, Kallus (2023), Evaluating the Surrogate Index as a Decision-Making Tool Using 200 A/B Tests at Netflix
Booking.com et al. KDD 2024, Choosing a Proxy Metric from Past Experiments
Pinterest Engineering, How Holdout Groups Drive Sustainable Growth
Athey, Chetty, Imbens, Kang (2019), The Surrogate Index NBER 26463
Gibson Biddle, #4 Proxy Metrics